|
The Kohonen Self-Organizing Map (SOM) is a powerful unsupervised learning neural network that is often used in pattern recognition, data mining, feature extraction and clustering. By applying the SOM in the spatial domain, we can extract characteristic spatial patterns of the input data matrix. If we transpose the data matrix, and apply the SOM in the time domain, we can extract characteristic temporal patterns, i.e., the characteristic time series. Since each of these time series represents the temporal variability of a particular region, this method can be used to identify regions of differentiated variability on a map. The SOM, when applied to both space and time domains of the same data, provides a powerful tool for diagnosing ocean processes from such different perspectives. Thus it is called "dual SOM" analysis by Liu et al. [2016]. The characteristic time series extracted by the SOM can be further analyzed using the rectified wavelet power spectral method [Liu et al., 2007], and this is called "joint SOM-wavelet analysis". The dual SOM is applied to the satellite altimetry data (1993-2015) in the eastern Gulf of Mexico (GoM) with a focus on the Loop Current (LC) system. Spatial patterns are characterized as different LC extensions and different stages in the process of LC eddy shedding. The temporal evolutions and the frequency of occurrences of these patterns are obtained, and the typical trajectories of the LC system progression on the SOM grid are investigated. For an elongated, northwest-extended, or west-positioned LC, it is common for the LC anticyclonic eddy (LCE) to separate and propagate into the western GoM, while an initially separated LCE in close proximity to the west Florida continental slope often reattaches to the LC and develops into an elongated LC, or reduces intensity locally before moving westward as a smaller eddy. Regions of differing SSH variations are also identified using the joint SOM-wavelet analysis. Along the general axis of the LC, SSH exhibits strong variability on time scales of 3 months to 2 years, also with energetic intraseasonal variations, which is consistent with the joint Empirical Orthogonal Function (EOF)-wavelet analysis. In the more peripheral regions, the SSH has a dominant seasonal variation that also projects across the coastal ocean. Detailed information can be found in Liu et al. [2016]:Liu, Y., R.H., Weisberg, S. Vignudelli, and G.T. Mitchum (2016), Patterns of the Loop Current system and regions of sea surface height variability in the eastern Gulf of Mexico revealed by the self-organizing maps, J. Geophys. Res. Oceans, 121, 2347-2366, http://dx.doi.org/10.1002/2015JC011493. Useful data analysis tools: |
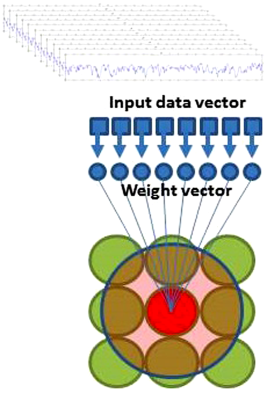
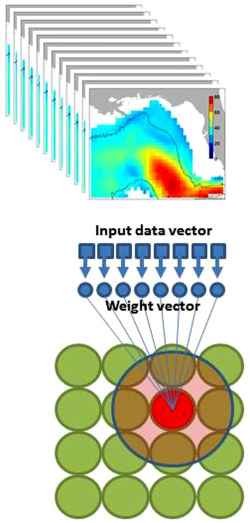
Architectures of 3x3 and 4x4 SOMs for temporal and spatial pattern extraction, respectively. The input data vectors are time series at each grid point (for time domain SOM anlysis) or maps (for spatial domain SOM analysis). (Figures 3 & 2 of Liu et al. [2016]) |
References:
- Liu, Y., and R.H. Weisberg (2005), Patterns of ocean current variability on the West Florida Shelf using the self-organizing map, Journal of Geophysical Research, 110, C06003, doi:10.1029/2004JC002786.
- Liu, Y., R.H. Weisberg, and C.N.K. Mooers (2006), Performance evaluation of the self-organizing map for feature extraction. Journal of Geophysical Research, 111, C05018, doi:10.1029/2005jc003117.
- Liu, Y., X.S. Liang, and R.H. Weisberg (2007), Rectification of the bias in the wavelet power spectrum, Journal of Atmospheric and Oceanic Technology, 24(12), 2093-2102.
- Liu, Y., and R.H. Weisberg (2011), A review of self-organizing map applications in meteorology and oceanography, in Self-Organizing Maps - Applications and Novel Algorithm Design, Edited by J. I. Mwasiagi, InTech, Rijeka, Croatia, ISBN 978-953-307-546-4, pp.253-272.
- Liu, Y., R.H., Weisberg, S. Vignudelli, and G.T. Mitchum (2016), Patterns of the Loop Current system and regions of sea surface height variability in the eastern Gulf of Mexico revealed by the self-organizing maps, Journal of Geophysical Research: Oceans, 121, 2347-2366, http://dx.doi.org/10.1002/2015JC011493.
- Liu, Y., R.H. Weisberg, J.M. Lenes, L. Zheng, K. Hubbard, and J.J. Walsh (2016), Offshore forcing on the "pressure point" of the West Florida Shelf: Anomalous upwelling and its influence on harmful algal blooms, Journal of Geophysical Research: Oceans, 121, 5501-5515, http://dx.doi.org/10.1002/2016JC011938.