|
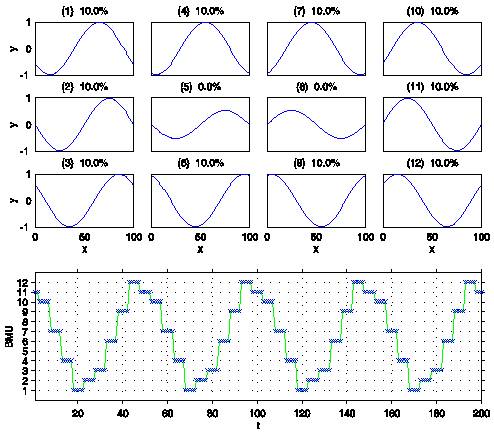
How to extract characteristic patterns from a long time series of maps? Snapshot may be the simplest method, but it is hard to find the typical patterns that can represent the entire time series. Temporal averaging may be simple, but it is difficult to define suitable time scale over which to average; thus, mean patterns may be very misleading. The Empitical Orthogonal Function (EOF) technique is widely used. It requires the data to be gaps-free; moreover, conventional EOF, as a linear method, may not be as useful in extracting nonlinear information. There is a need for effective feature extraction methods. The Kohonen Self-Organizing Map (SOM) is a neural network that maps high-dimensional input data onto a low-dimensional (usually two-dimensional) output space while preserving the topology. It finds its widespread use across a number of disciplines. Recently, it has been applied to meteorology and oceanography as an effective tool of nonlinear clustering, pattern recognition and feature extraction. Yonggang Liu is one of the SOM users in the oceanography community. He and his colleagues have successfully applied the SOM in a series of oceanogrpahic data analyses. Some of his SOM papers are summarized as follows: 1. Performance evaluation of the SOM for feature extraction Despite its wide applications as a tool for feature extraction, the SOM remains a black box to most meteorologists and oceanographers. Liu, Weisberg, and Mooers [2006] evaluates the feature extraction performance of the SOM by using artificial data representative of known patterns. The SOM is shown to extract the patterns of a linear progressive sine wave. Sensitivity studies are performed to ascertain the effects of the SOM tunable parameters. By adding random noise to the linear progressive wave data, it is demonstrated that the SOM extracts essential patterns from noisy data. Moreover, the SOM technique successfully chooses among multiple sets of patterns in contrast with an Empirical Orthogonal Function method that fails to do this. A practical way to apply the SOM is proposed and demonstrated using several examples, including long time series of coastal ocean currents from the West Florida Shelf. |
A 3x4 SOM representation of the linear progressive wave data. The top 12 panels show the SOM patterns with the frequency of occurrence atop each plot. The bottom plot is the BMU time series. (This is Figure 1 of Liu, Weisberg, and Mooers [2006]) |
2. SOM analysis of the coastal currents
Patterns of ocean current variability are examined on the West Florida Shelf using time series of moored velocity data that span the interval October 1998–September 2001 [Liu and Weisberg 2005]. On the synoptic weather timescale the variations of the SOM patterns are coherent with the local winds. On the seasonal timescale the variations of the SOM patterns are coherent with both the local winds and complementary sea surface temperature patterns. The spatial patterns extracted by the SOM method are asymmetric, a feature that is not captured by the conventional EOF method.
3. Joint SOM analysis of the HF radar and ADCP data
Patterns of ocean current variability are extracted from a joint HF radar and ADCP dataset to assess the 3D structures and temporal evolutions of distinct physical processes on the West Florida Shelf [Liu, Weisberg, and Shay 2007]. Three separate ocean–atmosphere frequency bands are considered: semidiurnal, diurnal, and subtidal. The currents in the semidiurnal band are relatively homogeneous in space, barotropic, clockwise polarized, and have a neap-spring modulation consistent with semidiurnal tides. The currents in the diurnal band are less homogeneous, more baroclinic, and clockwise polarized, consistent with a combination of diurnal tides and near-inertial oscillations. The currents in the subtidal frequency band are stronger and with more complex patterns consistent with wind and buoyancy forcing.
4. GHSOM analysis of the satellite SST data
The GHSOM is used to extract patterns of the SST variability on the West Florida Shelf from time series of daily SST maps from 1998 to 2002 [Liu, Weisberg, and He 2006]. Four characteristic SST patterns are extracted in the first-layer GHSOM array: winter and summer season patterns, and two transitional patterns. Three of them are further expanded in the second layer, yielding more detailed structures in these seasons. The winter pattern is one of low SST, with isotherms aligned approximately along isobaths. The summer pattern is one of high SST distributed in a horizontally uniform manner. The spring transition includes a midshelf cold tongue. Similar analyses performed on SST anomaly data provide further details of these seasonally varying patterns. It is demonstrated that the GHSOM analysis is more effective in extracting the inherent SST patterns than the widely used EOF method.
The SOM is used to examine spatial patterns of the Loop Current variability and to identify regions of SSH variability in the Gulf of Mexico from satellite altimetry data (1993 to 2015). More details can be seen in dual SOM analysis.
6. Other SOM and GHSOM applications
- SOM analysis of the satellite altimeter data [Liu, Weisberg, and Yuan, 2008]
- GHSOM application in satellite precipitation estimation [Hong et al., 2006]
- A review of SOM applications in meteorology and oceanography [Liu et al., 2011]
- The SOM is used to extract patterns the deep ocean-shelf interactions and to derive an offshore forcing index for the West Florida Shelf [Liu et al., 2016]
References:
- Liu, Y., and R.H. Weisberg (2005), Patterns of ocean current variability on the West Florida Shelf using the self-organizing map, Journal of Geophysical Research, 110, C06003, doi:10.1029/2004JC002786.
- Liu, Y., R.H. Weisberg, and C.N.K. Mooers (2006), Performance evaluation of the Self-Organizing Map for feature extraction. Journal of Geophysical Research, 111, C05018, doi:10.1029/2005jc003117.
- Liu, Y., R.H. Weisberg, and R. He (2006), Sea surface temperature patterns on the West Florida Shelf using Growing Hierarchical Self-Organizing Maps, Journal of Atmospheric and Oceanic Technology, 23(2), 325-338, http://dx.doi.org/10.1175/JTECH1848.1.
- Hong, Y., Y.-M. Chiang, Y. Liu, K.-L. Hsu, and S. Soroohian (2006), Satellite-based precipitation estimation using watershed segmentation and growing hierarchical self-organizing map, International Journal of Remote Sensing, 27(23), 5165-5184, doi:10.1080/01431160600763428.
- Liu, Y., R.H. Weisberg, and L.K. Shay (2007), Current patterns on the West Florida Shelf from joint Self-Organizing Map analyses of HF radar and ADCP data, Journal of Atmospheric and Oceanic Technology, 24(4), 702-712, http://dx.doi.org/10.1175/JTECH1999.1.
- Liu, Y., R.H. Weisberg, and Y. Yuan (2008), Patterns of upper layer circulation variability in the South China Sea from satellite altimetry using the Self-Organizing Map. Acta Oceanologica Sinica, 27(Supp.), 129-144.
- Liu, Y., P. MacCready, and B.M. Hickey (2009), Columbia River plume patterns in summer 2004 as revealed by a hindcast coastal ocean circulation model, Geophysical Research Letters, 36, L02601, doi:10.1029/2008GL036447.
- Jin, B., G. Wang, Y. Liu, and R. Zhang (2010), Interaction between the East China Sea Kuroshio and the Ryukyu Current as revealed by the Self-Organizing Map, Journal of Geophysical Research, 115, C12047, doi:10.1029/2010JC006437.
- Liu, Y., and R.H. Weisberg, 2011: A review of Self-Organizing Map applications in meteorology and oceanography. In Self-Organizing Maps - Applications and Novel Algorithm Design, Edited by J. I. Mwasiagi, InTech, Rijeka, Croatia, ISBN 978-953-307-546-4, pp.253-272.
- Liu, Y., R.H., Weisberg, S. Vignudelli, and G.T. Mitchum (2016), Patterns of the Loop Current system and regions of sea surface height variability in the eastern Gulf of Mexico revealed by the Self-Organizing Maps, Journal of Geophysical Research: Oceans, 121, 2347-2366, http://dx.doi.org/10.1002/2015JC011493.
- Liu, Y., R.H. Weisberg, J.M. Lenes, L. Zheng, K. Hubbard, and J.J. Walsh (2016), Offshore forcing on the "pressure point" of the West Florida Shelf: Anomalous upwelling and its influence on harmful algal blooms, Journal of Geophysical Research: Oceans, 121, 5501-5515, http://dx.doi.org/10.1002/2016JC011938.
Useful MATLAB toolboxes: